If you are starting to learn about the foreign exchange market (Forex), read this A-Z guide on Forex for beginners to understand basic concepts and trading strategies.
With this knowledge, you can become a successful trader in the Forex market.
Table of Contents
Forex for Beginners Guide
The foreign exchange market (Forex) is the largest financial market in the world, with a daily trading volume reaching trillions of USD. This market allows traders to buy and sell currency pairs from different countries with the hope of profiting from changes in their values. Traders can participate in this market through online Forex trading platforms.
What is the Forex Market?

The Basics of Forex Trading
To start trading Forex, you need to understand basic concepts such as currency pairs, exchange rates, buy/sell orders, leverage, and spread.
Currency Pairs: Currency pairs compare the value of one currency to another.
Here are some common currency pairs and examples of their exchange rates:
- EUR/USD: Euro (EUR) versus US Dollar (USD). For example, if the exchange rate is 1.18, one Euro equals 1.18 US Dollars.
- GBP/USD: British Pound (GBP) versus US Dollar (USD). For example, if the exchange rate is 1.38, one British Pound equals 1.38 US Dollars.
- USD/JPY: US Dollar (USD) versus Japanese Yen (JPY). For example, if the exchange rate is 110.50, one US Dollar equals 110.50 Japanese Yen.
- USD/CAD: US Dollar (USD) versus Canadian Dollar (CAD). For example, if the exchange rate is 1.25, one US Dollar equals 1.25 Canadian Dollars.
- AUD/USD: Australian Dollar (AUD) versus US Dollar (USD). For example, if the exchange rate is 0.74, one Australian Dollar equals 0.74 US Dollars.
Exchange Rate: The exchange rate is the value of one currency compared to another.
For example, if the EUR/USD exchange rate is 1.20, one Euro (EUR) equals 1.20 US Dollars (USD). If you have 100 EUR, when converted to USD, you would get 120 USD.
Buy/Sell Orders: A buy/sell order is a request placed by a trader in the financial market to buy or sell an asset such as stocks, currencies, commodities, or securities.
In the forex market, buy/sell orders are used to trade currency pairs. Here are the common types of buy/sell orders in forex:
- Buy Order: An order to purchase a currency pair, hoping the value will increase.
- Sell Order: An order to sell a currency pair, hoping the value will decrease.
- Market Order: An order to buy or sell a currency pair immediately at the current market price.
- Pending Order: An order to buy or sell a currency pair in the future when the price reaches a specified level. Types of pending orders include:
- Buy Limit: Buy at a price below the current market price.
- Sell Limit: Sell at a price above the current market price.
- Stop Order: Buy or sell at a price above or below the current market price.
Leverage: Leverage allows you to trade with more money than you actually have.
In forex, leverage is a financial tool that allows traders to open a larger trading position than their actual capital. It is expressed as a ratio, such as 1:100, 1:200, 1:500, etc.
For example, with a $1,000 account balance and 1:100 leverage, you can open a position worth $100,000 in the forex market. Each pip movement in the currency pair’s value will impact your profit or loss by $10. However, leverage can also increase risk, as a small market movement can lead to significant losses.
Spread: The spread is the difference between the buy (bid) and sell (ask) price of a currency pair.
For example, if the EUR/USD bid price is 1.2000 and the ask price is 1.2005, the spread is 0.0005, or 5 pips.
Understanding these concepts will help you make more informed trading decisions.
Types of Currencies and How to Read Price Charts
In the Forex market, there are many different currencies. Each currency pair has its own price chart, showing the value of that pair over time.
To read price charts, you need to understand concepts such as the opening price, closing price, highest price, and lowest price within a specific time frame.
You also need to analyze technical indicators like MA (Moving Average), RSI (Relative Strength Index), and MACD (Moving Average Convergence Divergence) to make more accurate trading decisions.
However, remember that reading price charts and analyzing technical indicators is a continuous learning process that requires time to hone your skills.
Popular Currencies:
- USD (United States Dollar) – US Dollar
- EUR (Euro) – Eurozone
- JPY (Japanese Yen) – Japanese Yen
- GBP (British Pound) – British Pound
- AUD (Australian Dollar) – Australian Dollar
- CAD (Canadian Dollar) – Canadian Dollar
- CHF (Swiss Franc) – Swiss Franc
- NZD (New Zealand Dollar) – New Zealand Dollar
- CNY (Chinese Yuan) – Chinese Yuan
- INR (Indian Rupee) – Indian Rupee
These are just some popular currencies, and there are many others used around the world. These currencies are often traded and quoted in currency pairs, such as EUR/USD (Euro against US Dollar), GBP/JPY (British Pound against Japanese Yen), AUD/CAD (Australian Dollar against Canadian Dollar), etc.
Reading Price Charts:
Reading price charts is a crucial skill in trading and market analysis. Here’s a basic guide to reading price charts:
- Opening Price: The price at which a currency pair opens at the beginning of a trading period.
- Closing Price: The price at which a currency pair closes at the end of a trading period.
- Highest Price: The maximum price reached by a currency pair within a trading period.
- Lowest Price: The minimum price reached by a currency pair within a trading period.
Analyzing Technical Indicators
Understanding and utilizing technical indicators like Moving Averages (MA), Relative Strength Index (RSI), and Moving Average Convergence Divergence (MACD) can help you make more informed trading decisions. However, remember that mastering these tools requires continuous learning and practice.
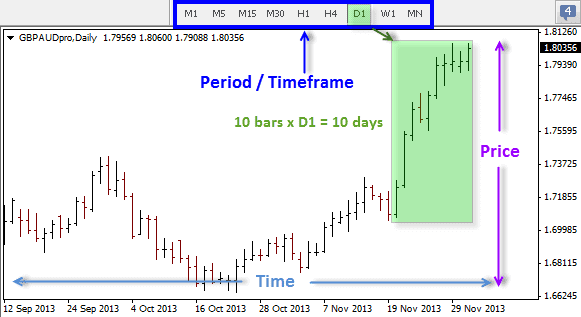
Time Axis (X-axis)
The horizontal axis of the chart represents time, divided into different time frames such as days, hours, and minutes.
Price Axis (Y-axis)
The vertical axis of the chart represents the price levels of the analyzed asset, such as currency pairs, stocks, commodities, etc.
Bar Chart (Candlesticks)
Candlesticks are a popular method for representing the price value of an asset over a specific period. Each candlestick typically has two parts: the body and the wick.
- Body: Represents the difference between the opening price (open) and the closing price (close) of that period. If the closing price is higher than the opening price, the body will be colored black or green. Conversely, if the closing price is lower than the opening price, the body will be colored white or red.
- Wick (Shadow): Represents the highest and lowest prices that the asset reached during that period. The wick can extend above or below the body, forming upper and lower tails.
Line Chart
A line chart is another way to represent the asset’s value over time. It connects the data points of value to create a seamless line.
Technical Indicators
In addition to basic price charts, traders can use technical indicators to help analyze and predict the asset’s price trends. Popular indicators include moving averages, MACD (Moving Average Convergence Divergence), RSI (Relative Strength Index), and many others.
Most importantly, to read price charts effectively, traders need to master basic concepts, apply technical analysis, and stay informed about news and fundamental factors affecting the market.
Basic Trading Strategies
To become a successful trader in the Forex market, you need to have basic trading strategies.
- Trend Trading: One of the most popular strategies is trend trading. This means buying when prices are rising and selling when prices are falling.
- News Trading: Another strategy is news trading, where you make trading decisions based on economic news and global events.
- Reversal Trading: You can also use a reversal trading strategy, where you buy when prices are falling and sell when prices are rising.
However, remember that no strategy is perfect, and you need to experiment and adjust your strategy to achieve success in the Forex market.
Important Notes When Trading Forex
When starting to trade in the Forex market, there are several important notes to keep in mind.
- Understand the Basics and Technical Indicators: Ensure you have a clear understanding of the basic concepts and technical indicators before you start trading.
- Set Goals and Manage Risk: Always set goals and manage your risk. Setting goals helps you focus on what’s important, and managing risk helps you minimize potential losses.
- Stay Calm and Patient: Always stay calm and patient. The Forex market can be volatile, and there’s no guarantee that you’ll always be right. However, if you have a good strategy and remain calm in all situations, you can achieve success in this market.
You might be interested:


Comments (No)